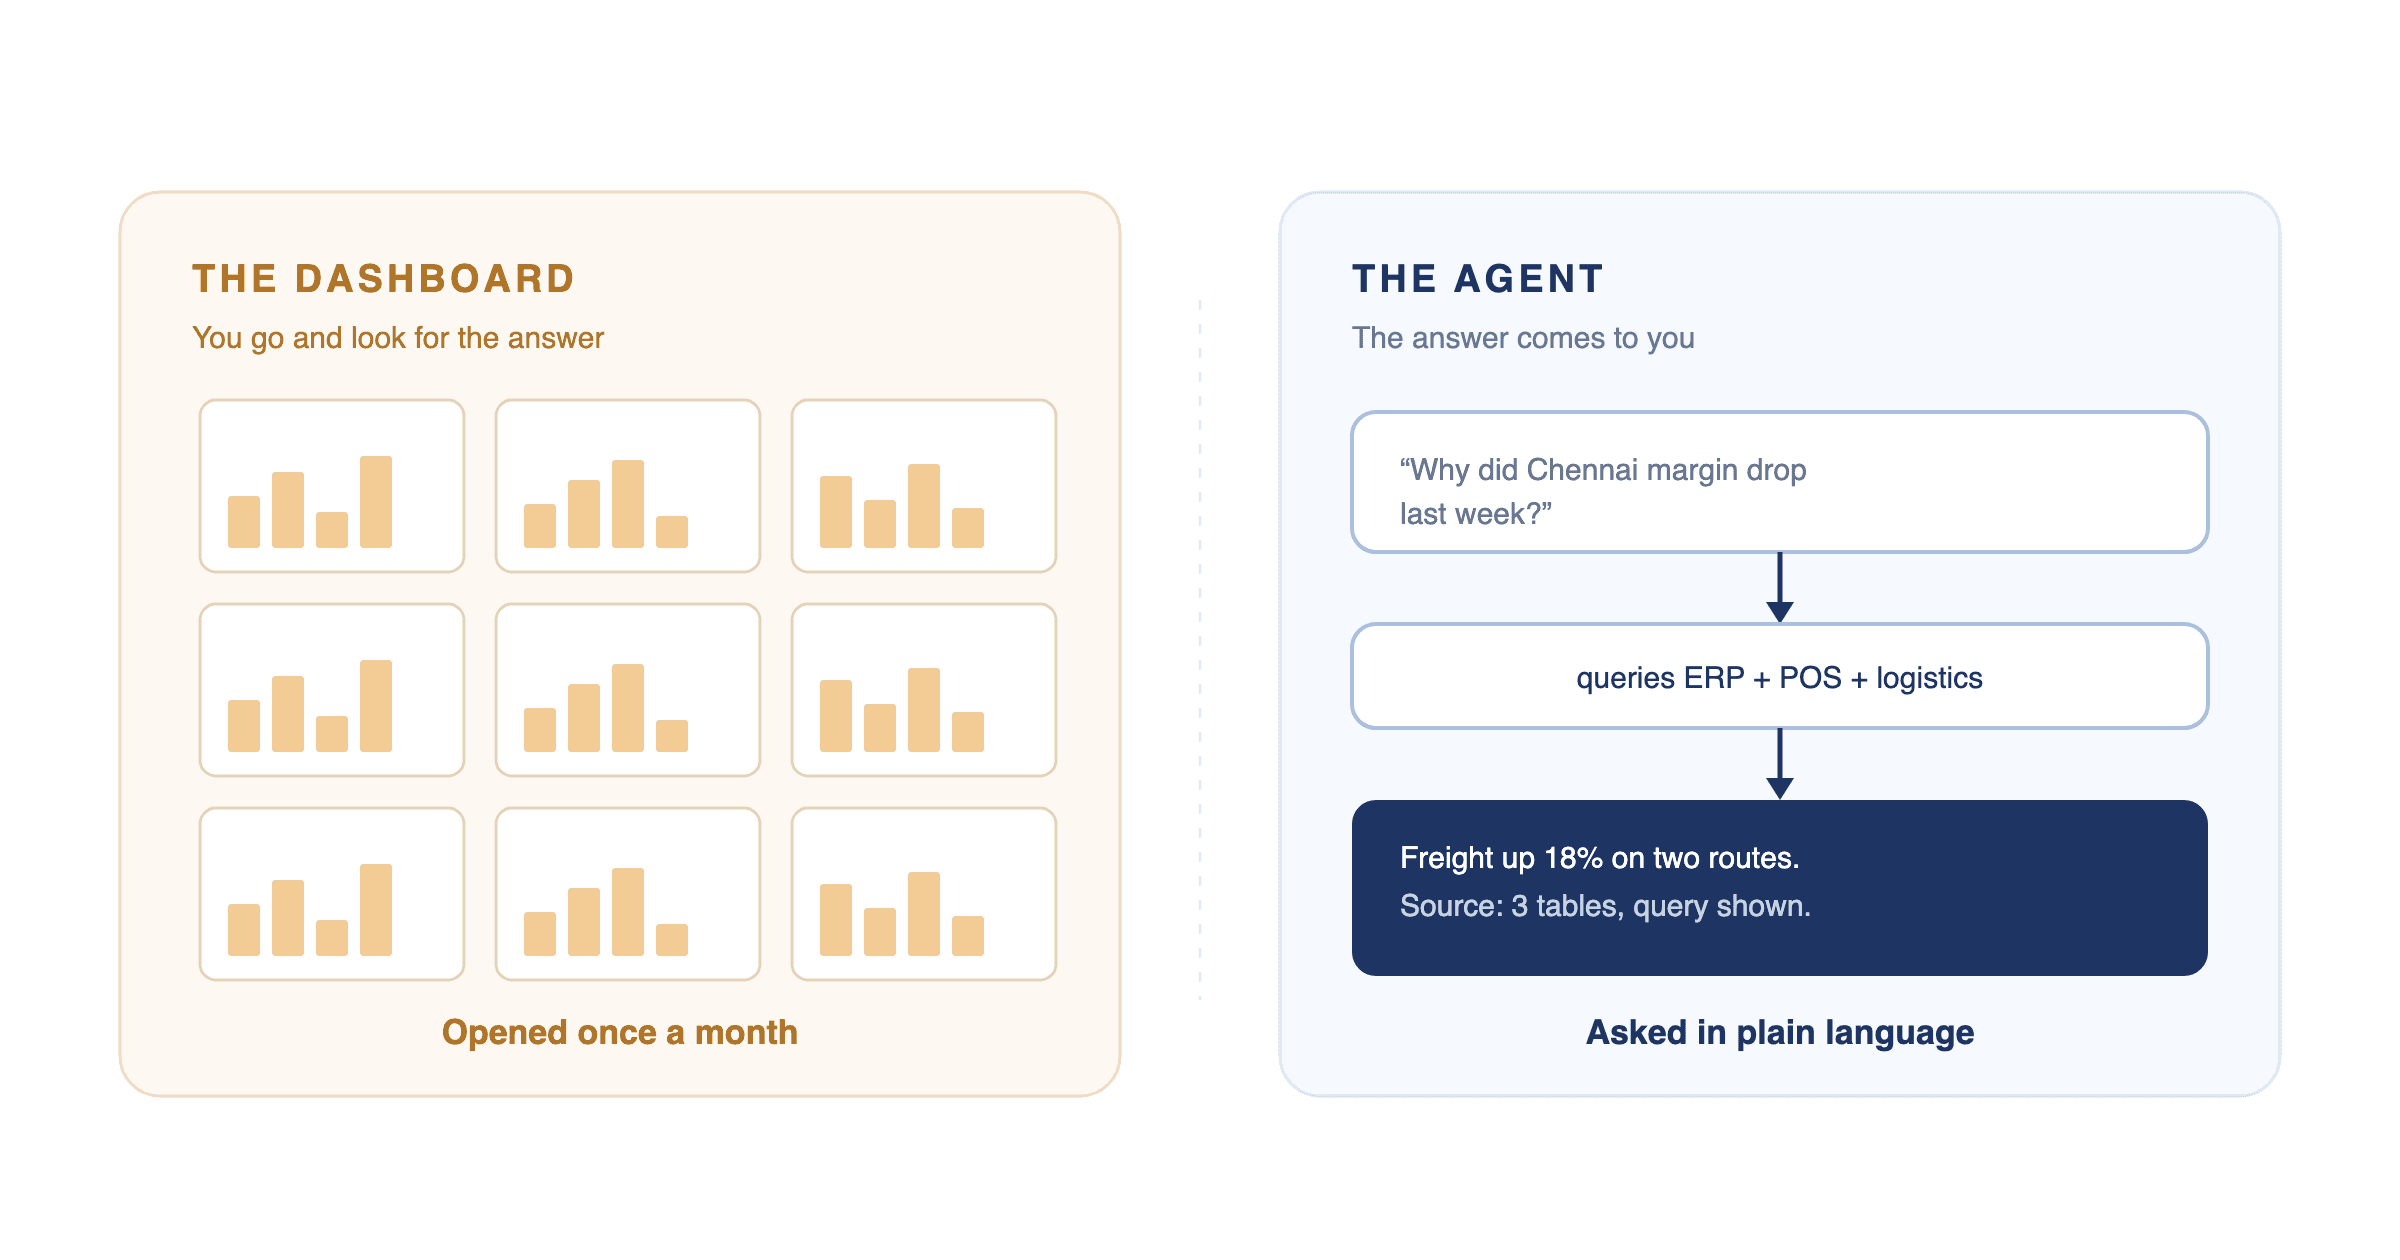
Every company we audit has dashboards. Almost none of them get used.
They were built with care, they're accurate, and they sit unopened for weeks. Then something goes wrong, somebody opens twelve tabs trying to work out why, gives up, and asks an analyst — who spends a day writing SQL to answer a question that was urgent yesterday.
The problem isn't the dashboard. It's that a dashboard can only answer questions you anticipated when you built it, and the questions that matter are the ones you didn't.
That's the gap analytics agents fill. Here's where they work, where they don't, and what has to be true before you build one.
What an analytics agent actually is
Someone asks a question in plain language. The agent works out which systems hold the answer, writes the queries, runs them, and replies — with the numbers, the reasoning, and a link to the query it ran.
"Why did Chennai margin drop last week?" Instead of a chart you have to interpret, you get: freight cost up 18% on two routes, driven by a carrier rate change on the 3rd, affecting 40% of shipments — here's the query.
Two things distinguish this from a chatbot bolted onto a BI tool:
It joins across systems. The real answer usually spans your ERP, your POS, and your logistics provider. A dashboard built on one warehouse can only see what was loaded into it.
It watches, as well as answers. The higher-value mode isn't question-answering at all — it's the agent noticing that a metric moved outside its normal range and telling you before you thought to ask.
The second one is where the money is
Question-answering is what gets demoed. Monitoring is what pays.
Most businesses don't lose money because someone couldn't get an answer. They lose it because nobody asked the question for three weeks. A supplier quietly raised prices. A product's return rate crept up. One store's shrinkage doubled. All visible in the data, all sitting in a dashboard nobody opened.
An agent that watches your core metrics, understands what "normal" looks like for each, and flags real deviations with a plausible cause attached, is worth considerably more than one that waits to be asked.
Design for that from the start. If you build only the chat interface, you'll get a flurry of use in week one and near silence by week six — the same fate as the dashboard.
The precondition that kills most of these projects
Your agent is only as good as your data model, and it will expose exactly how bad it is.
This is the uncomfortable part. When an analyst writes a query, they carry a decade of undocumented knowledge: that orders contains test rows from before March, that region was repurposed in 2024, that you have to exclude status = 9 because it means cancelled-but-billed, that revenue means net of returns except in the board deck.
None of that is written down. An agent doesn't know it, so it produces a confident, wrong number — and confident wrong numbers in a business report are worse than no report, because someone acts on them.
So before building, you need:
A semantic layer. One authoritative definition of your core metrics — revenue, margin, active customer, churn — as code, not as tribal knowledge. What tables, what filters, what exclusions. This is real work and it's the bulk of the project.
Documented quirks. Every "you have to exclude" rule, written down and encoded.
A tight scope. Point the agent at a handful of well-understood tables, not your whole warehouse. Accuracy on ten trusted tables beats coverage across two hundred you can't vouch for.
Teams that skip the semantic layer and point an agent at a raw warehouse get a demo that impresses in the room and gets abandoned within a month, because finance found three numbers that didn't reconcile.
Non-negotiable: show the query
Every answer must come with the SQL, the tables touched, and the filters applied.
This does three things. It lets an analyst verify a number before it reaches a customer or a board. It makes errors findable — a wrong answer with a visible query is a five-minute fix; a wrong answer with no working is unfalsifiable. And it builds trust: people start by checking every query, then spot-checking, then trusting. They will never get there if they can't check.
If a vendor won't show you the generated query, treat that as disqualifying.
Read-only, and mean it
An analytics agent needs no write access. Ever.
Give it a read-only database user, scoped to the specific tables it needs. Not a shared application credential. Not "read-write but we told it not to write."
Also think about what it can read. If it can query the salary table, then anyone who can talk to it can read salaries. Row-level and column-level permissions need to mirror the permissions of the person asking — the agent should see exactly what that user would see, and nothing more. Getting this wrong turns a reporting tool into a data-leak channel, and it's the most common security mistake we see in these builds.
Cost deserves a guard too. A carelessly generated query against a large table can be expensive and slow. Enforce query timeouts, row limits, and a cost ceiling.
Where it pays, and where it doesn't
Good fits:
- Multi-system businesses. Retail with separate POS, inventory and accounting. Manufacturing with ERP plus machine data. The answer genuinely requires a join nobody has pre-built.
- Operational metrics that move daily. Stock, margin, delivery performance, machine uptime. Things where a three-week-old surprise is expensive.
- Teams with more questions than analyst hours. The bottleneck is analyst availability, not the existence of data.
- Distributed operations. Fifty stores, two hundred machines, forty sites — where "which one is the outlier this week" is a real and recurring question.
Poor fits:
- One system, few metrics. If everything lives in one tool and you track eight numbers, a well-made dashboard is better, cheaper and more reliable.
- Messy data with no owner. Fix the data first. An agent on bad data industrialises the production of wrong answers.
- Regulatory or statutory reporting. Anything filed or audited needs deterministic, reviewed pipelines. Use the agent to explore; don't use it to file.
- Nobody acts on the numbers. If the current reports go unread because no one changes anything, faster answers won't help. That's an organisational problem.
A build order that works
1. Semantic layer for five metrics. Just five, the ones your leadership actually asks about. Define them as code, agree them with finance, and make them the single source of truth. Most of the project's value and most of its effort sit here.
2. Read-only access, permission-mirrored. Scoped user, table allow-list, per-user row and column visibility, query timeouts and cost caps.
3. Question-answering over those five. Narrow, accurate, with the query always shown. Let people try to break it, and fix what they find.
4. Monitoring on the same five. Learn the normal range, alert on genuine deviation, attach a probable cause. This is the part that keeps getting used.
5. Widen only when trust is earned. Add metrics once the first five have gone a month without a reconciliation dispute.
Four to eight weeks for the first useful version, most of it spent on the semantic layer rather than the agent.
What to measure
Accuracy on a known set. Keep thirty questions with analyst-verified answers. Run them after every change. This is your regression test, and without it you'll ship a change that silently breaks a definition.
Correction rate. How often does someone check the query and find it wrong? Should fall over time. If it's flat, something structural is wrong.
Alerts acted on. Of the deviations it flagged, how many led to a decision? Low numbers mean the thresholds are too sensitive, and alert fatigue will kill it.
Analyst time recovered. The clearest ROI number, and the easiest to measure — count the ad-hoc requests that stopped arriving.
The honest summary
An analytics agent is worth building when your answers genuinely span several systems, when the questions change faster than you can build dashboards, and when someone will act on what it surfaces.
It is not worth building on data nobody trusts. The semantic layer is the project; the agent is the interface on top of it. Teams that understand that ship something people use. Teams that don't ship a demo.
If you're weighing this against other AI ideas, the four filters apply here too — and the review pattern in human-in-the-loop AI is what "show the query" is really implementing.
Want to know if your data is ready?
We build analytics and workflow agents for Indian businesses — including the semantic layer underneath, which is the part that decides whether it works. Two weeks, fixed scope: we look at your systems and data quality and tell you honestly whether an agent is the right next step, or whether the money is better spent fixing the pipeline first.
Bengaluru-based, working with clients across India and globally.
Get in touch · See our agentic AI work · WhatsApp: +91 9677749648